Thurston County Hydrologic Cycle
by: Nadine Romero Posted on: November 26, 2010
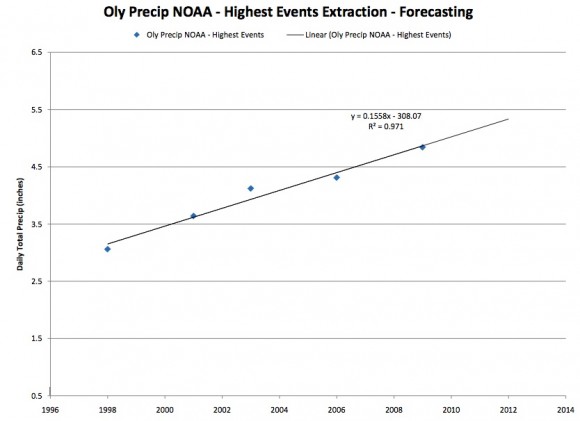
Editor’s Note: The graph above documents the highest rainfall event for the given years at the Olympia, WA airport.
By Nadine Romero, Adjunct Professor of Geology, St. Martin’s University and Thurston County Hydrogeologist, L.G, L.HG.
An understanding of the hydrological cycle is key to sustaining and managing agricultural, urban and wild land everywhere. New groundwater analysis models built with remarkable ‘real time’ hydrologic data compiled by the Thurston County Water Resources Program will give us stronger predictions and understanding of our hydrogeological systems, both below and above ground.
Until recently, Thurston Country streams had not been notably quantified or measured since the 1940s and 50s, when the U.S. Geological Survey began collecting information on primarily the larger rivers of the county, such as a the Dechutes and the Chehalis. The Water Resources Program now collects over a million pieces of hydrologic datum annually. In the past three years that I have been assisting Thurston County departments of hydrogeology and hydrologic science I have studied climate patterns using precipitation stations, groundwater monitoring systems and rapidly-updated stream gauges which collect river height levels every 15 minutes. So, by the end of the year we determine the total volume of water that ran through the river and the daily average flow.
Below the surface, around 70 groundwater-monitoring wells have been built to better understand how the water table rises and falls throughout the year with precipitation. With more frequent and intense storms recorded at the NOAA weather station at the Olympia Airport, groundwater flooding necessitated the installation of a greater range of monitoring wells over the last decade. We gather hourly data from these wells to assess the less completely known subterranean portion of the hydrological cycle, creating a bigger and more complete picture.
We also monitor rainfall patterns. As seen in the NOAA Olympia Airport rainfall record, our storms have become more frequent and more intense in the last decade. Of our 17,900 daily rainfall records the top 20 have fallen in the last two decades. These are rainfall events greater than 2.9 inches. Since 2000, we have had four storms dropping more than 3.6 inches. On January 7, 2009, one precipitation station located at Summit Lake measured an incredible 7 inches of rain. Findings from our 10 county-wide precipitation stations align with regional-scale climate models from the University of Washington that predict general warming trends, hotter summers, slightly lower yearly rainfall and intense storm events. ‘Drought years’ of less than 45 inches of total yearly rainfall are more frequent despite these unusually common 100-year storm events. Water is not being distributed evenly over the course of the winter months. These abnormalities in the local hydrological cycle, as they become more common, must be studied closely.
We are moving ahead in Thurston County to build numerical ground water models using our fabulous ‘real time’ hydrologic data which will build better prediction and forecasting of our hydrologic systems.
All of the credit for collecting this information goes to my colleagues at the county in Water Resources who are working hard to understand our hydrologic cycle.
One Response to “Thurston County Hydrologic Cycle”
Articles On Water
Water: Water
- May 2 Part 1: Oregon County Faces Gas Industry Funding, Lobbyists in Battle to Halt Jordan Cove LNG Project
- Dec 8 Bottled Water Facility Stopped, Local Government Replaced
- Nov 8 Washington State attempts to sell Columbia River water for $6 million
- Aug 8 USA Refuses to Ban Atrazine
- Aug 8 When Public Utility Districts Forget Who They Serve
- Jul 8 Water Quality, Who Should Decide?
- Jan 14 The Balancing Act: Exploring Water in the Skagit Basin
- Jun 30 Water in the West: Diverse Tools for Conserving our Rivers and Communities
- May 20 Managing Many Waters the Walla Walla Way
- Mar 19 The Clean Water Act – A Story of Activism and Change
- Mar 2 Privatizing a Basic Human Right: Water
- Feb 17 A complicated situation: Lake Roosevelt and the Grand Coulee Dam
- Feb 10 Bottle the Skagit River?
- Nov 20 One Step Back for Clean Water in the Boise River
- Nov 13 If it Ain’t Broke, Don’t Fix It: Portland’s Water System
- Oct 15 Protecting Our Region From Hanford’s Spreading of Contamination and From Being Used (Again) as a National Radioactive Waste Dump
- Sep 15 New Gold Rush Threatens the West
- Jun 2 America’s Antiquated Mining Policy
- Mar 15 Drinking Water in Bellingham and much of Whatcom County
- Nov 26 Thurston County Hydrologic Cycle
- Nov 14 River Watch-Thomas Creek
- Nov 11 Water Wealth
- Oct 21 River Watch-The Teanaway
- Oct 21 Why Conserve Water in the Pacific Northwest?


by: Patrick Yirkaon: Thursday 6th of September 2012